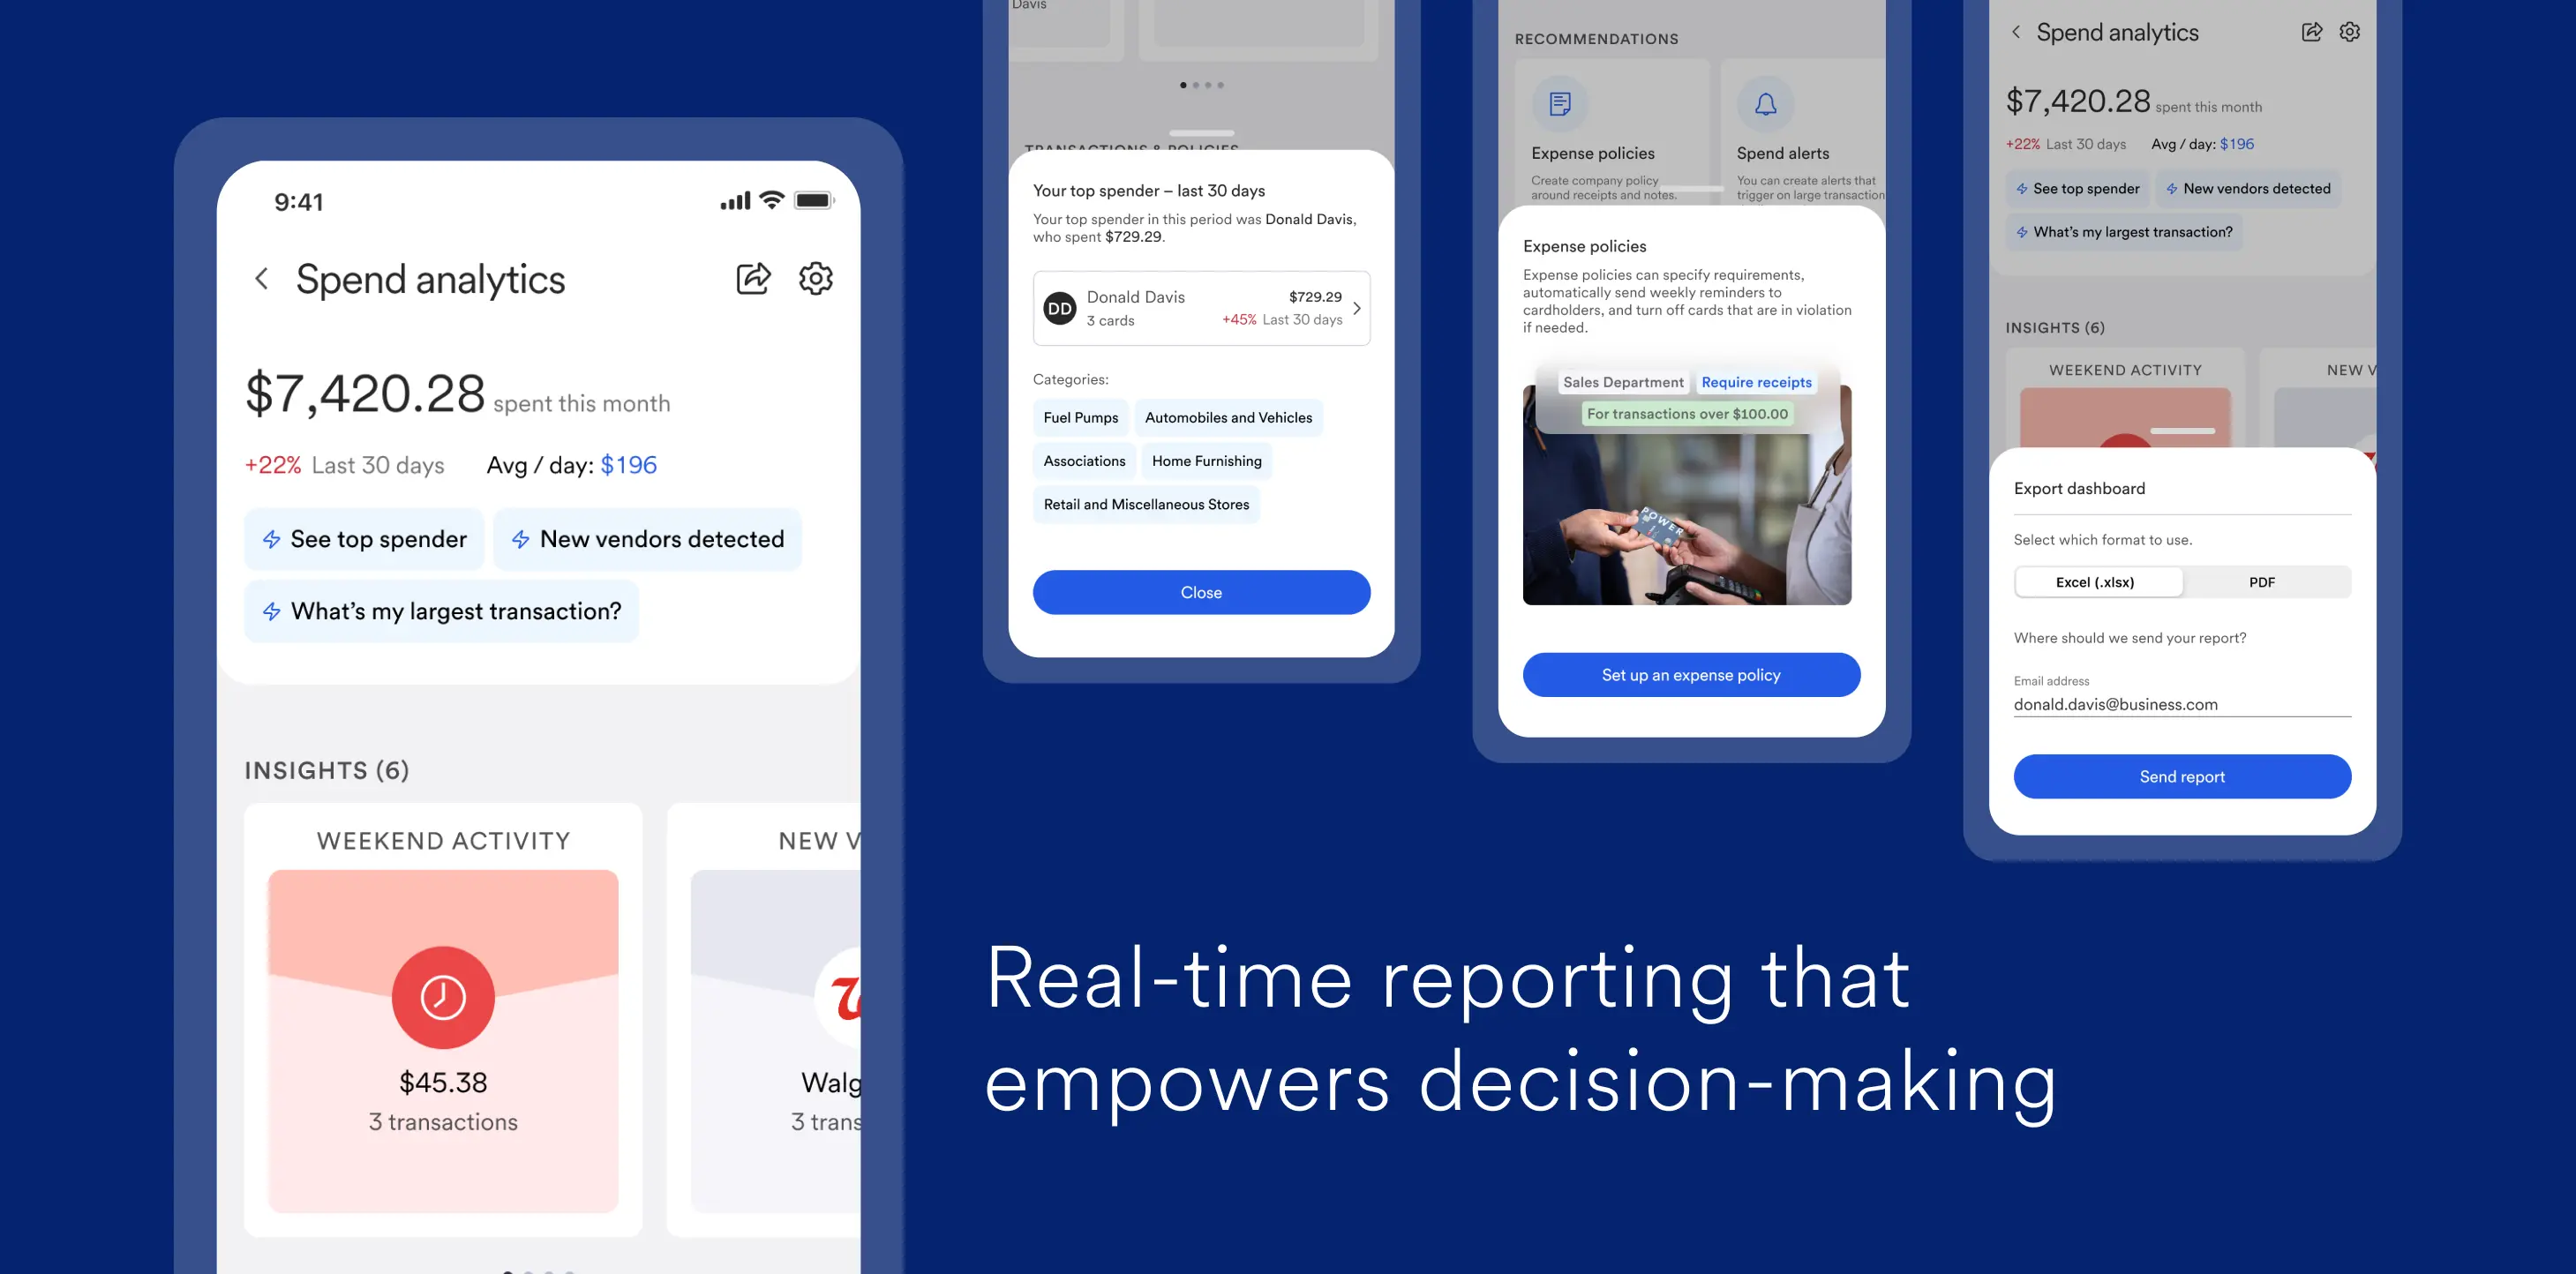
Crafting an insights + analytics dashboard for business owners

CREDIT CARDS B2B APP UX

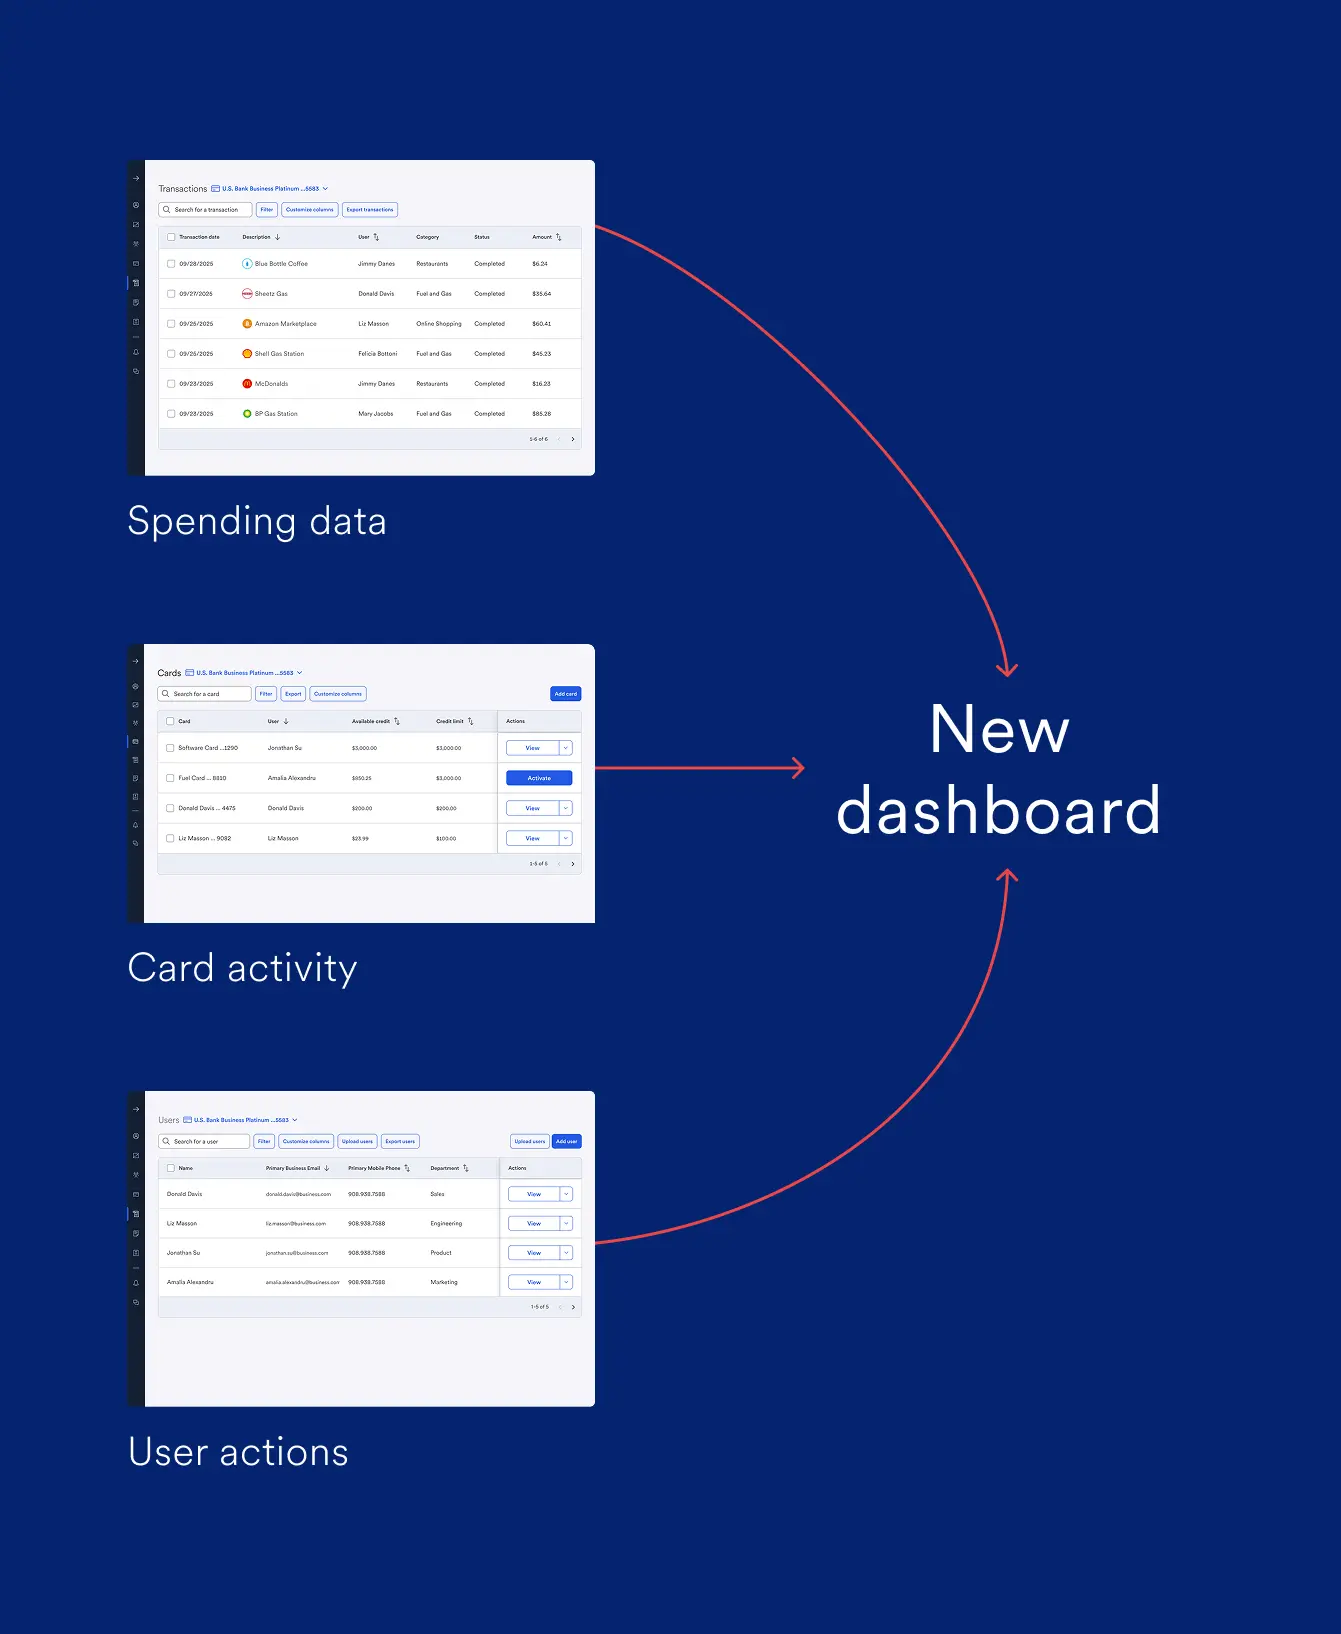
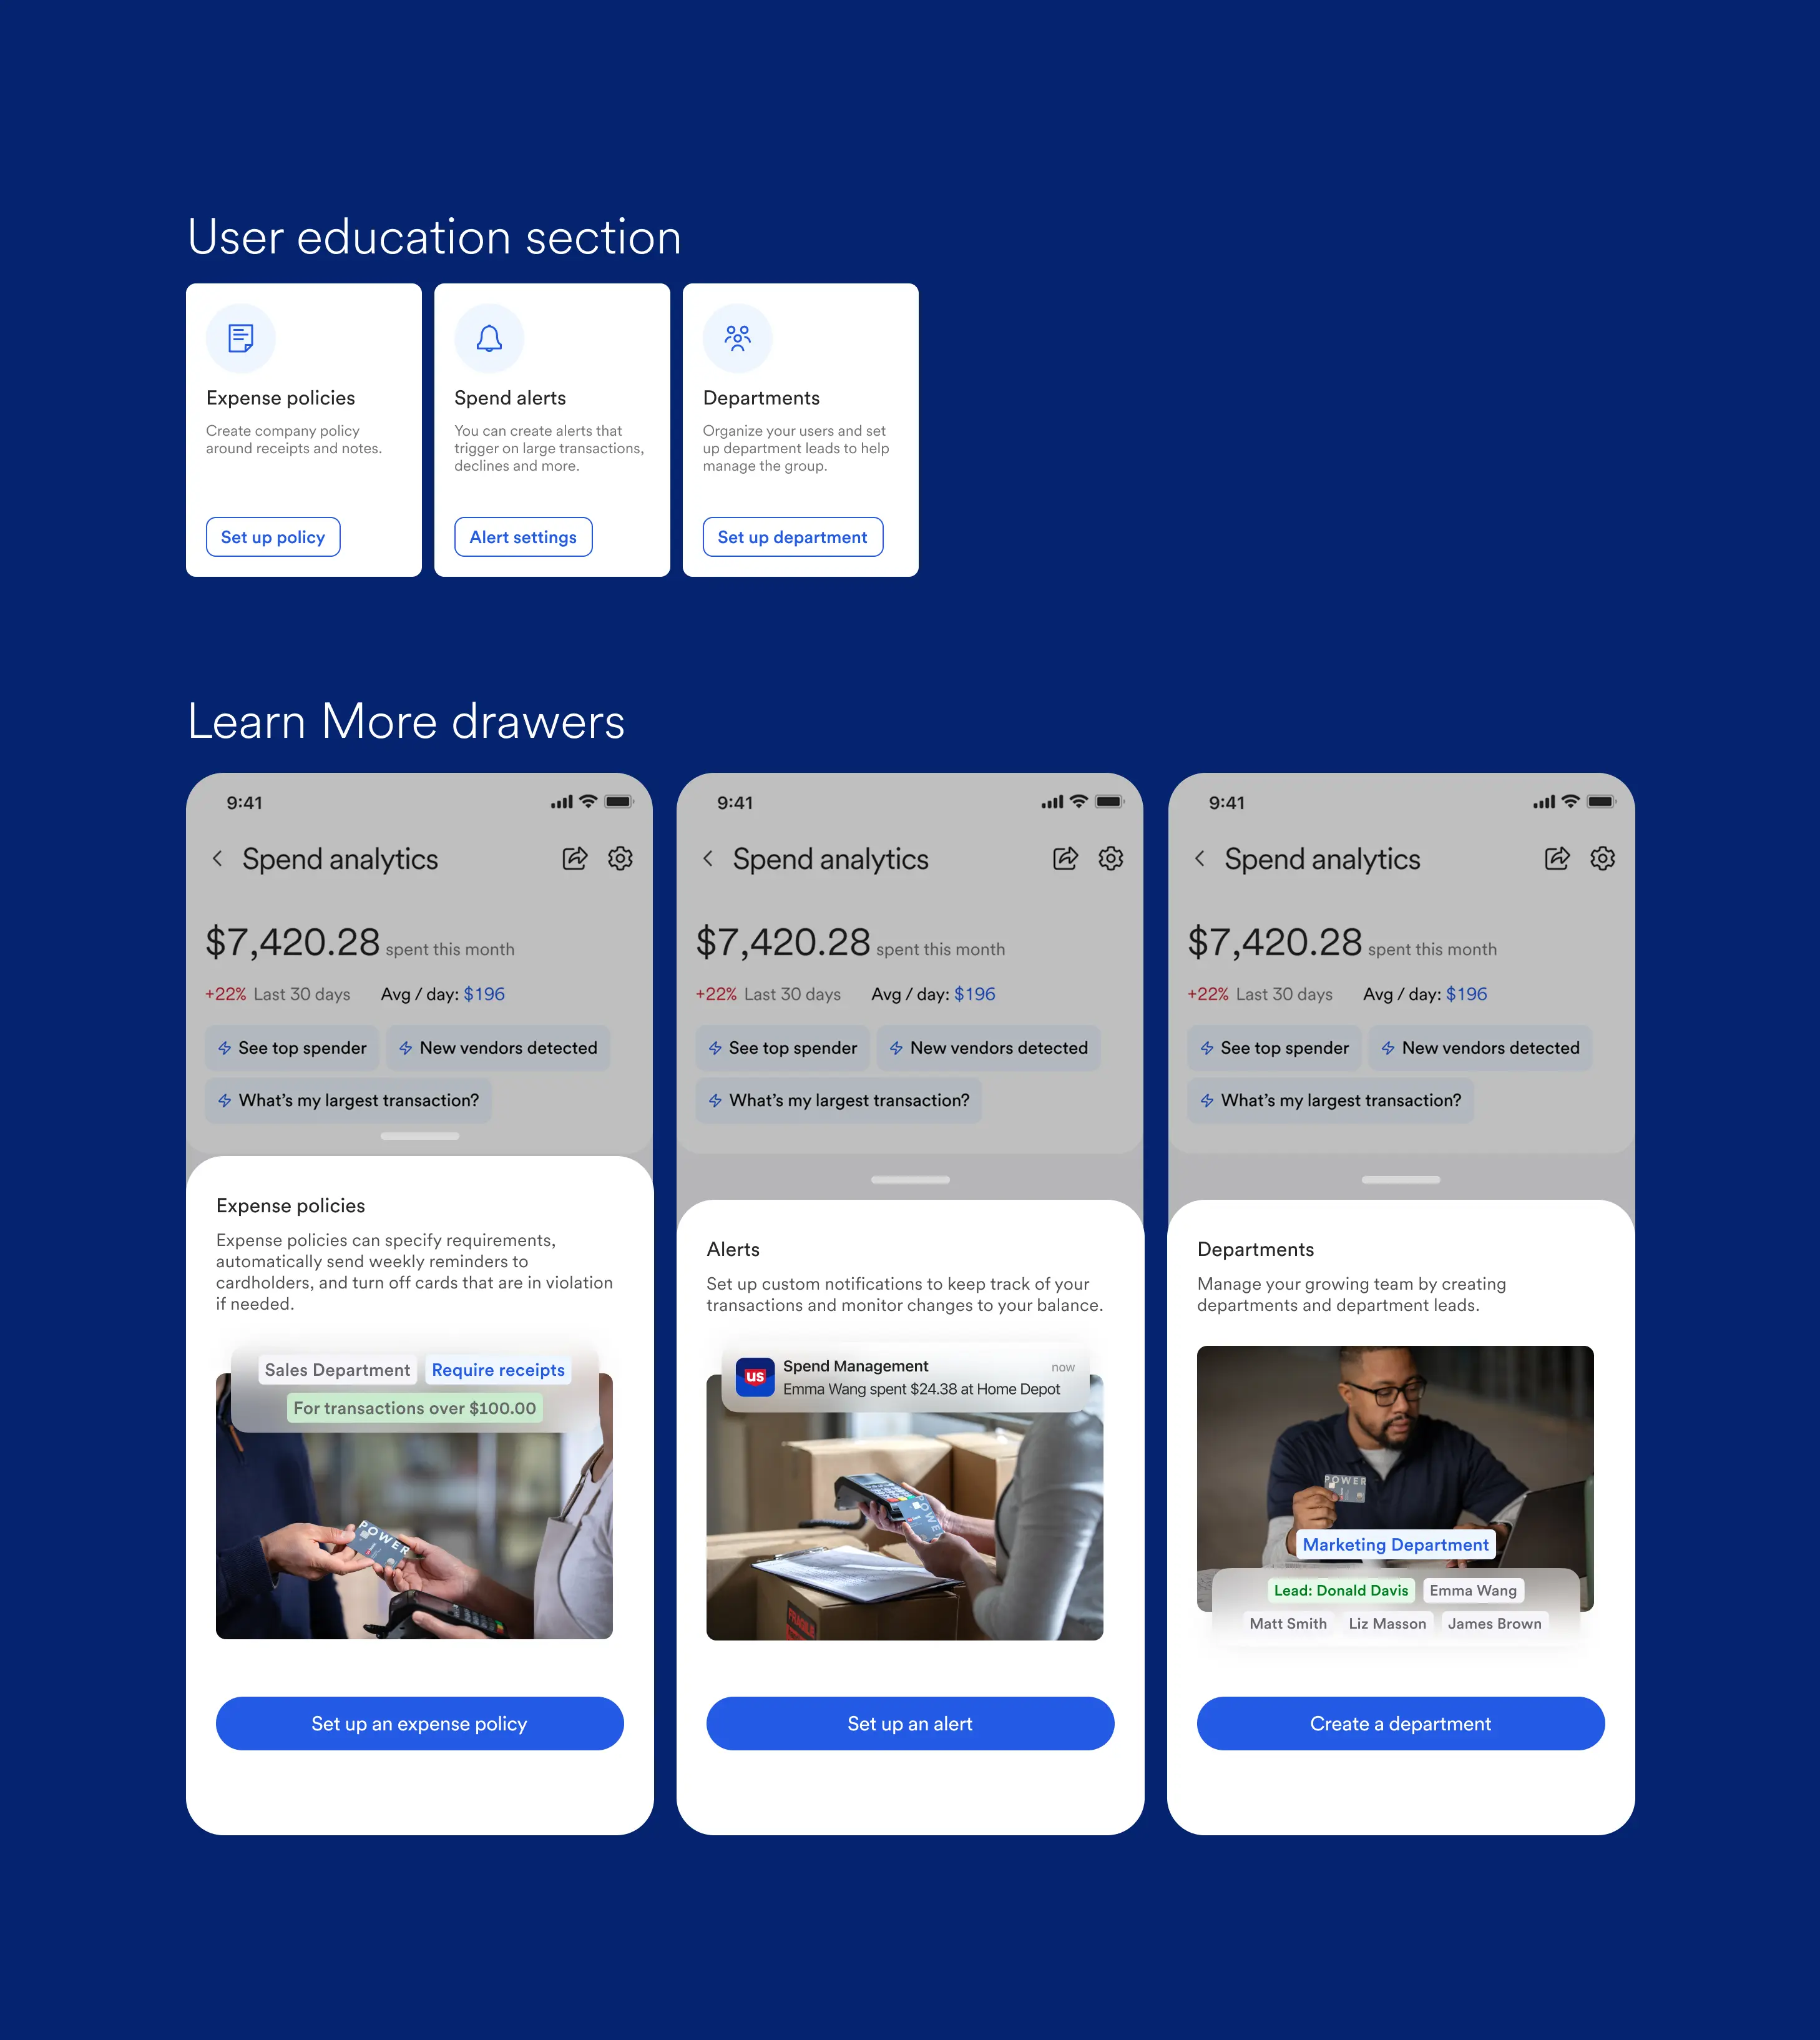
This is a dashboard I designed at U.S. Bank to help business owners understand their unstructured spending, and make decisions. It's part of a larger product - which you can view here.

The overarching goals were to tie together features into an easy-to-digest dashboard with data we already had access to, and drive adoption of our premium subscription.

You
Hey! Who is this app for?
Chris Z
Hi!
This dashboard is for small business owners at U.S. Bank.
They have a number of employees with company cards (up to dozens) and need to track activity, spot red flags, and make decisions about policy.

Challenge

This project had a limited scope: the ask was to create a new dashboard feature using only existing assets. Those assets come in the form of unstructured transaction data, user actions, and card activity. Users were already able to download this info as Excel files, but this is a very manual and time-consuming way to process that data.

Solution

We combined that data into a digestible, easy-to-use, and shareable dashboard that displays what the user cares about most:

Actionable insights for their business

Alerts for bad spending behavior

Onboarding for useful features

You
Who did you do this work with?
Chris Z
I was not alone, that's for sure.
I worked with a tight team of a Lead Product Manager, and a Content Writer. We were equal partners in defining requirements as the original ask was quite broad.
I handled visual execution, user interviews, and even creation of marketing assets.

User discovery

To help narrow down the scope, we spoke to users. These were customers of U.S. bank, with an established use of a company cards for their employees. Interviews with them involved:

Understanding their role (CFO, owner, accountant, controller, etc)

Detailing their day to day

Identifying their goals and pain points

Asking about their existing tools (competitors)

Chris Z
Here's how it works.
We surface insights by first analyzing transaction data, looking for red flags, and then selecting the most significant changes.

When an insight is selected, the user can look for more info via a drawer: which in turn links out to other features in the platform.

You
How did this dashboard improve business metrics?
Chris Z
Great question.
On top of tying features together, we also created improved adoption by advertising unused features to users.
For new users, sections like this on the dashboard greatly increased feature discovery.

Interactive prototype

Here's the mobile app prototype. Feel free to click around and look into the data! Press Z to resize the screen.

Takeaways

Not every project is a saga. This dashboard was an exercise in delivering a quick win with a tight team and limited assets: we did a quick calibration using user research, then delivered 2-3 months of design iteration before launching.

I learned about the day-to-day of business owners, and what red flags they look for—it turns out, a lot of the job is very manual! Truth be told, all this work can be done by scanning thousands of rows in Excel—the value added here is the time saved and overall convenience.

Previous U.S. Bank Home Next NorthShore